Business research methods are the backbone of smart decision-making. Whether you’re a founder testing a new idea, a marketer measuring campaign ROI, or an MBA student writing a dissertation — the ability to design and execute research determines how quickly you cut through guesswork.
Written by Deepak Singh, Founder — The DM School (Google Partner; 1 Lakh+ students trained; ₹100 Cr+ client revenue managed). This credibility matters because research isn’t theory here — it’s practice, tested across campaigns, markets, and Indian business realities.
In this detailed guide, we’ll cover everything: philosophies, research designs, sampling techniques, data collection methods, analysis frameworks, ethics, and AI-driven research tools. You’ll also see India-first examples (FMCG launches, edtech surveys, A/B tests in digital ads, policy evaluations) that make these concepts real and practical.
By the end, you’ll know not just the types of business research methods — but also how to choose the right one for your business challenge.
Types of Business Research Methods
- 1) Introduction to Business Research Methods
- 2) The Business Research Process
- 3) Philosophical Foundations of Research
- 4) Research Designs in Business
- 5) Strategies for Business Research
- 6) Measurement in Business Research
- 7) Sampling in Business Research
- 8) Data Collection Methods
- 9) Instrument Design & Questionnaire Construction
- 10) Data Analysis in Business Research
- 11) Causal Inference for Business Decisions
- 12) Business Research Ethics & Governance
- 13) AI & Technology in Business Research
- 14) Emerging Trends & Future of Business Research
- 15) Applications of Business Research
- 16) Tools & Platforms for Business Research
- 17) Case Studies in Business Research
- 18) Conclusion & Key Takeaways
- 19) FAQ on Business Research Methods
1) Introduction to Business Research Methods
Business research methods refer to the structured techniques companies use to collect, analyze, and interpret data in order to make better decisions. Unlike gut-based decision-making, business research provides evidence — whether you’re sizing a market, testing a product, or measuring an ad campaign.
At its core, business research answers three big questions:
- What is happening? (Descriptive research: market trends, consumer behavior)
- Why is it happening? (Exploratory & causal research: motivations, drivers, causes)
- What should we do next? (Applied research: strategy, pricing, channel choices)
Scope of Business Research
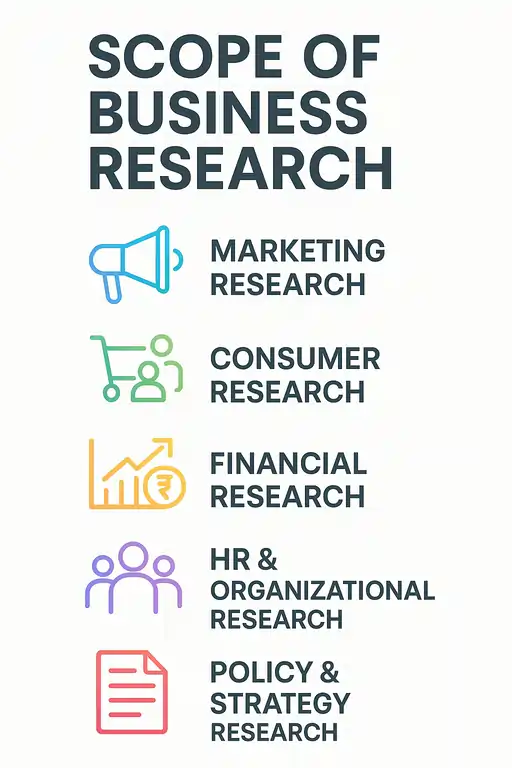
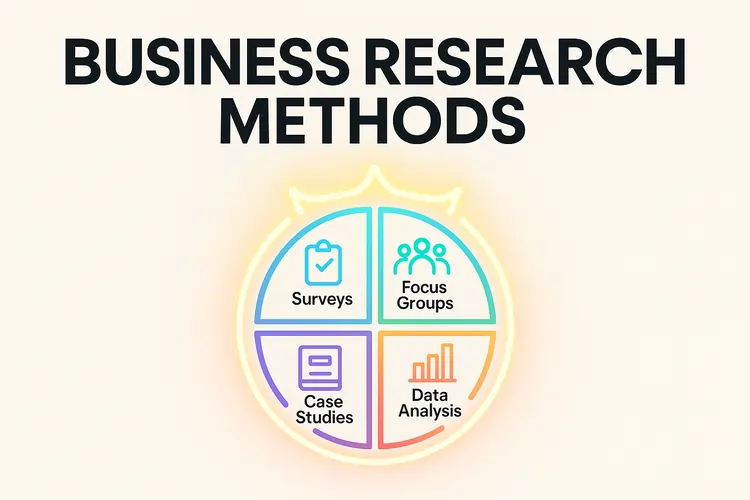
Business research isn’t limited to market research. It covers:
- Marketing research: ad testing, customer journeys, campaign effectiveness.
- Consumer research: needs, attitudes, buying patterns across Tier-1, Tier-2, and Tier-3 cities in India.
- Financial research: investor analysis, risk studies, feasibility checks.
- HR & organizational research: employee satisfaction, retention drivers, culture audits.
- Policy & strategy research: evaluating the impact of regulations, subsidies, or corporate policies.
India-First Examples
- FMCG: Before launching a new snack, ITC conducts taste tests (qualitative) + large surveys (quantitative) across multiple states.
- Edtech: Byju’s uses A/B testing on ad creatives to see which messaging converts more parents into trial users.
- E-commerce: Flipkart mines CRM data to understand purchase frequency during festivals like Diwali vs normal months.
- Startups: D2C brands in fashion rely on Instagram polls + focus groups to identify the next product line.
Business Research vs Academic Research
Academic research focuses on building theory, often with longer timelines and peer-reviewed rigor. Business research focuses on solving immediate problems — fast, applied, and ROI-driven. Both use similar methods, but the objectives differ:
- Academic research = “Does this add to knowledge?”
- Business research = “Does this reduce risk and improve decisions?”
Pro Tip: For Indian businesses, don’t confuse market research with business research. Market research is just one part — business research also includes HR, operations, finance, and policy evaluations. Treat it as a full toolkit, not just consumer surveys.
2) The Business Research Process (Step-by-Step)
The most reliable way to run business research is to move from the big question to precise actions using a structured flow. We’ll use a practical version of the Research Onion: start wide (philosophy, approach), get specific (design, strategy, sampling), and finish with instruments, fieldwork, analysis, and reporting.
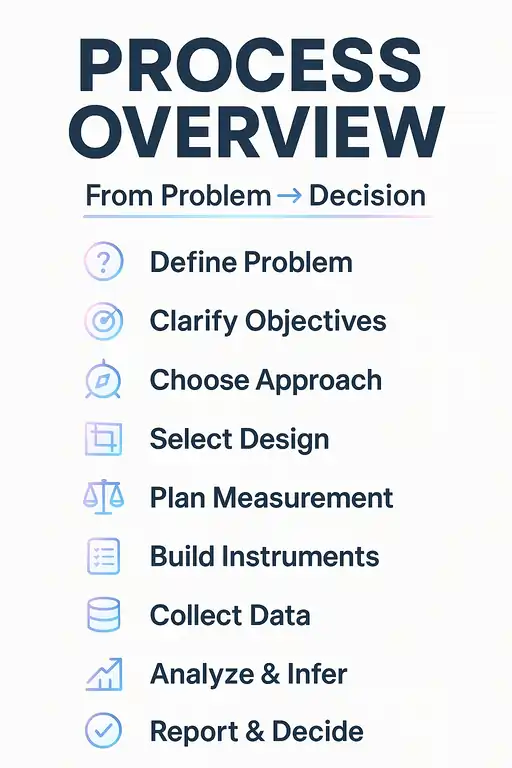
2.1 Process Overview (From Problem → Decision)
- Define the decision problem (what will change if we learn X?).
- Clarify objectives & hypotheses (what we need to prove/disprove).
- Choose philosophy & approach (positivist/interpretivist/pragmatist; deductive/inductive/abductive).
- Select design & strategy (exploratory/descriptive/causal; survey, case study, experiment, ethnography…).
- Plan measurement & sampling (constructs, scales, reliability; probability vs non-probability).
- Build instruments & fieldwork plan (questionnaires, interview guides, pilots, quality controls).
- Collect data (primary/secondary; online/phone/in-person; logging).
- Analyze & infer (quant/qual/mixed; diagnostics; causal tests where relevant).
- Report & decide (limitations, risks, recommendations, next experiments).
2.2 The “Research Onion” Layers (Manager’s Edition)
Layer 1 — Problem Framing
Translate vague asks (“sales are down”) into researchable questions (“which segments declined, and why?”). Define the decision tied to the outcome (e.g., “increase conversion rate by 20% in Q3”).
Layer 2 — Philosophy & Approach
- Positivist + Deductive for measurement-heavy, hypothesis testing (e.g., pricing elasticity).
- Interpretivist + Inductive to explore meanings/motivations (e.g., why users churn).
- Pragmatist + Abductive to iterate between data and theory (common in startups).
Layer 3 — Design (Exploratory, Descriptive, Causal)
- Exploratory: clarify problems via interviews, focus groups, desk research.
- Descriptive: quantify “what is” via surveys, panels, observational data.
- Causal: test “did X cause Y?” via experiments or quasi-experiments.
Layer 4 — Strategy (Pick the vehicle)
- Survey for scalable measurement (attitudes, incidence, NPS).
- Case study for deep dives into a brand/market/site.
- Ethnography/Observation to see real behavior (store visits, app sessions).
- Experiment (A/B, multivariate) to attribute lift; this is where your ad testing lives — see our India-specific playbook in Facebook Ads in India: Complete Guide.
- Action research when the team changes a process while studying it (agile ops).
- Grounded theory to build theory from data (useful for new categories).
Layer 5 — Time Horizon
- Cross-sectional: snapshot (fast, cost-effective; watch for seasonality bias).
- Longitudinal: repeated tracking over time (panels, cohorts; stronger for trend/causality).
Layer 6 — Measurement & Sampling
Define constructs (e.g., brand trust), choose scales (Likert/semantic), set reliability targets (α≥0.70), and pick sampling method:
- Probability (SRS, stratified, cluster) for inference and margins of error.
- Non-probability (quota, purposive, snowball) for speed/hard-to-reach — disclose limits.
Size samples with power when possible; otherwise justify via variance, desired precision, and decision risk.
Layer 7 — Instruments, Fieldwork & Quality
- Questionnaires: plain language, one-idea-per-item, avoid leading/double-barrel; include “Prefer not to say.”
- Interview guides: start broad → narrow; pilot with 3–5 interviews; refine probes.
- Pilot & cognitive testing: detect ambiguity, length, routing issues.
- Field controls: attention checks, speeders, geo flags, recontact audits.
2.3 Execution: Data Collection → Analysis → Decisions
Collect data through primary methods (online survey/CATI/in-person, interviews, observation) and secondary sources (CRM, analytics, industry reports). Maintain consent logs and data-protection notes.
Analyze: descriptives & inference (t/χ²/ANOVA, regression, forecasting), market-research staples (factor/cluster, conjoint/MaxDiff), qualitative coding (open→axial→selective, thematic analysis), and mixed-methods integration. For causality, run A/B where feasible; otherwise use DiD, Synthetic Control, or SDID with diagnostics.
Decide & report: state limitations (sampling, measurement, identification), quantify risk ranges, and recommend actions with expected impact (“Lift +3–5% CR with variant B; retest in Tier-2 cities”).
2.4 Mini Checklists (Copy-Paste Ready)
- Problem sheet: decision owner, objective metric, horizon, constraints, must-know questions.
- Design sheet: design type, strategy, time horizon, sampling frame, N, instruments, pilots.
- Field sheet: recruitment rules, QC checks, consent text, data retention, escalation plan.
- Analysis sheet: primary/secondary endpoints, model specs, robustness, viz plan, sign-off.
2.5 Common Pitfalls (and How to Avoid Them)
- Vague objectives → unusable data: Write the decision question first; make hypotheses testable.
- Sampling mismatch: Cheap panels that don’t represent your target; fix with screening + quotas.
- Bad instruments: Leading questions and long forms cause bias and fatigue; pilot and shorten.
- Underpowered studies: Too-small N → false negatives; estimate power or plan staged sampling.
- “Analysis paralysis”: Pre-commit to decision rules (“ship variant if CR lift ≥3% @ p<.05”).
- No causality plan: If you must claim impact, design an experiment or a defensible quasi-experiment upfront.
Pro Tip: Treat the process as loops, not a line. Start with exploratory qual → build a tight survey → run an A/B → feed learnings back into strategy. This loop beats one-and-done research every time.
3) Philosophical Foundations of Business Research
Behind every business research method sits a philosophy — an assumption about how knowledge should be created and interpreted. You don’t need to be a philosopher to run research, but understanding these foundations helps you choose the right approach for the right problem. In business, this can be the difference between data that convinces stakeholders and data that gets ignored.
3.1 Positivism
Positivism assumes the business world can be studied objectively, like the physical sciences. Numbers, patterns, and measurable facts matter most. This philosophy is behind surveys, experiments, and statistical analysis. If you want to know whether a new Facebook ad increases conversions, you run an A/B test, measure outcomes, and let the data speak.
Indian example: Flipkart testing whether “free delivery” vs “₹50 cashback” drives higher conversions is pure positivism in action.
3.2 Interpretivism
Interpretivism sees business reality as socially constructed — shaped by culture, perception, and meaning. Here, the goal is to understand the why behind behavior, not just measure it. Techniques include in-depth interviews, focus groups, ethnography, and observation.
Indian example: A D2C ayurvedic brand conducting home visits in Tier-2 cities to understand how families perceive “natural” vs “chemical” products.
3.3 Pragmatism
Pragmatism says: don’t be locked into one philosophy. Use whatever works to answer the question. In practice, this often means mixed methods — combining surveys with interviews, or experiments with qualitative follow-ups. Pragmatism is popular in fast-moving businesses where speed and utility trump purity.
Indian example: An edtech startup first runs a quick poll on Instagram stories (quant) to test interest, then follows up with 10 one-on-one calls (qual) to refine product features.
3.4 Research Approaches: Deductive, Inductive, Abductive
- Deductive: Start with a theory, then test it with data. Example: “Higher discounts increase sales” → run regression on sales data.
- Inductive: Start with observations, then build theory. Example: Observe how Gen Z shops on Myntra, then generate insights about impulsive buying patterns.
- Abductive: Move back-and-forth between data and theory. Example: See a sudden drop in YouTube ad conversions, generate hypotheses, test them, refine theory.
3.5 Matching Philosophy to Business Problems
The best researchers don’t cling to one philosophy — they align it with the business challenge:
- Market sizing → Positivist + Deductive (surveys, panels, statistical projections).
- Exploring new cultural categories → Interpretivist + Inductive (interviews, ethnography).
- Rapid startup testing → Pragmatist + Abductive (lean surveys + quick experiments).
Pro Tip: Don’t get stuck debating philosophies. In business, what matters is fitness-for-purpose. Choose the philosophy that gives you insights your leadership team will actually act on.
4) Research Designs in Business
Once the philosophy and approach are clear, the next step is choosing the research design — the blueprint that guides how data will be collected and analyzed. In business research, the three most common designs are exploratory, descriptive, and causal. Each design serves a different purpose, and using the wrong one can waste time and money.
4.1 Exploratory Research
Exploratory research is used when the problem is not well-defined. It’s about discovering ideas, spotting patterns, and framing questions for further study. This is common for startups entering new categories or corporates testing innovations.
- Techniques: Literature reviews, expert interviews, focus groups, pilot surveys.
- Strengths: Flexible, fast, helps avoid blind spots.
- Weaknesses: Can’t generalize results; more about direction than precision.
Indian example: A D2C skincare startup interviewing dermatologists and Gen Z consumers before launching a new organic product line.
4.2 Descriptive Research
Descriptive research paints a detailed picture of “what is.” It answers questions like: Who are our customers? How often do they buy? What channels do they prefer? This is the most widely used design in market research.
- Techniques: Surveys, panels, observation, secondary data analysis.
- Strengths: Scalable, provides measurable benchmarks, good for segmentation.
- Weaknesses: Doesn’t explain why patterns exist; purely observational.
Indian example: Nielsen conducting household panels across Tier-1 and Tier-2 cities to measure monthly FMCG purchases.
4.3 Causal Research
Causal research investigates cause-and-effect relationships. It’s about proving that X leads to Y. This is critical for ad testing, pricing experiments, and product changes where ROI needs to be measured precisely.
- Techniques: Experiments, A/B testing, quasi-experiments (e.g., Difference-in-Differences, Synthetic Control).
- Strengths: Identifies impact clearly, reduces guesswork, supports high-stakes decisions.
- Weaknesses: More resource-intensive, needs control groups, not always feasible.
Indian example: Zomato running an A/B test to see whether a ₹100 discount coupon increases first-order conversions more than free delivery offers.
4.4 Choosing the Right Research Design
In practice, businesses often move through these designs in sequence:
- Start with exploratory research to define the problem.
- Move to descriptive research to quantify the opportunity.
- Finish with causal research to test which decision creates the best impact.
This layered approach ensures that decisions are both insight-driven and ROI-tested.
Pro Tip: In fast-moving Indian markets, it’s tempting to skip exploratory steps and jump into experiments. Don’t. A few hours of exploratory interviews can save lakhs in wasted ad budgets and failed launches.
5) Strategies for Business Research
Once you choose the research design, the next step is selecting the specific strategy — the practical way to gather and analyze data. Each strategy comes with strengths, weaknesses, and ideal use cases. Smart businesses often combine multiple strategies to build stronger insights.
5.1 Surveys & Questionnaires
Surveys are the backbone of quantitative business research. They help measure consumer attitudes, behaviors, and preferences at scale. Questionnaires can be distributed online, via phone, or in person, depending on the target audience.
Indian example: An edtech company surveying 5,000 parents across metro and Tier-2 cities to understand willingness to pay for hybrid learning models.
5.2 Case Studies
Case studies provide an in-depth look at a single company, market, or event. They’re widely used in MBA classrooms and corporate strategy teams to extract lessons from real-world examples.
Indian example: A detailed study on how Amul scaled its supply chain from Gujarat to nationwide dominance.
5.3 Experiments & A/B Testing
Experiments test cause-and-effect relationships. A/B testing is the most common form, widely used in digital marketing and product optimization. By splitting users into groups and exposing them to different versions, businesses can see which variant performs better.
Indian example: A YouTube campaign tested two creatives — one focused on discounts, the other on brand trust — to see which drove more sign-ups. You can see a detailed case study of this approach in our YouTube Ads India Case Study, where structured A/B testing delivered 33,500 conversions at just ₹57–₹58 CPA.
5.4 Ethnography & Observational Research
Ethnography studies behavior in natural settings. Businesses use it to understand how consumers actually interact with products and services, often revealing insights surveys miss.
Indian example: Observing shoppers in Big Bazaar to see how they navigate store layouts and promotional displays.
5.5 Action Research
In action research, companies implement changes while simultaneously studying the effects. It’s iterative and collaborative — research and action happen together.
Indian example: A startup tweaking its customer support script weekly while gathering data on satisfaction and repeat orders.
5.6 Grounded Theory
Grounded theory builds concepts from data rather than testing pre-existing theories. It’s useful in new industries where little prior research exists.
Indian example: A fintech startup interviewing early users to build a theory about trust barriers in digital lending.
Pro Tip: Don’t stick to just one strategy. Combine them — run exploratory interviews, then surveys, then A/B tests. This triangulation gives richer insights and stronger credibility with stakeholders.
6) Measurement in Business Research
In business research, what gets measured gets managed. But concepts like brand trust, employee motivation, or customer satisfaction are abstract. To make them usable, researchers translate them into constructs, variables, and scales. Good measurement ensures data is reliable, valid, and meaningful for decision-making.
6.1 Constructs, Variables & Indicators
Constructs are abstract concepts (e.g., customer loyalty). To study them, we break them into variables (e.g., repeat purchase rate, NPS score) and then into measurable indicators (e.g., “How likely are you to recommend us to a friend?” on a 0–10 scale).
Indian example: For Flipkart, “customer satisfaction” can be measured by delivery time, return ease, and repeat order frequency.
6.2 Scales of Measurement
There are four main types of scales in business research. Choosing the wrong one can make analysis meaningless:
- Nominal: Labels only, no order. Example: Male/Female/Other; city names.
- Ordinal: Ranked order, but gaps unequal. Example: Customer satisfaction: Poor → Excellent.
- Interval: Ordered with equal gaps, but no true zero. Example: Temperature in Celsius, brand attitude scales.
- Ratio: Ordered, equal intervals, true zero. Example: Sales revenue, number of purchases.
Indian example: Measuring “monthly household income” (ratio scale) vs “socio-economic classification” (ordinal scale) in consumer surveys.
6.3 Reliability in Business Research
Reliability means consistency — will the measurement give the same result if repeated? Common methods include:
- Test-retest: Running the same survey twice to check stability.
- Internal consistency: Checking if related items (like brand trust questions) produce consistent answers. Cronbach’s alpha (α ≥ 0.70) is the benchmark.
- Inter-rater reliability: Ensuring multiple coders interpret qualitative data the same way.
Indian example: A food delivery app checks reliability by re-contacting a subset of customers to validate their earlier survey responses about satisfaction.
6.4 Validity in Business Research
Validity asks: are we measuring what we think we’re measuring?
- Face validity: Does the question look sensible? (e.g., “How fast was delivery?” for measuring service speed).
- Content validity: Does it cover all aspects of the construct? (brand trust = quality, honesty, reliability).
- Construct validity: Does it align with theory? (loyal customers should also score high on advocacy).
- Criterion validity: Does it predict real-world outcomes? (NPS predicting renewal rates).
Indian example: An insurance company tests if its “customer satisfaction index” actually predicts policy renewals (criterion validity).
6.5 Operationalizing Abstract Concepts
Business success often depends on measuring intangible constructs. The key is to break them into measurable actions:
- Brand trust: % of consumers agreeing “This brand delivers on promises.”
- Employee motivation: Number of discretionary work hours, survey items on enthusiasm, turnover rates.
- Customer loyalty: Repeat purchase % + NPS + average order value over time.
Pro Tip: In India, measurement often fails when surveys use English-only wording. Always translate into local languages, run cognitive interviews, and back-translate to ensure reliability and validity.
7) Sampling in Business Research
No business can survey the entire population. That’s why researchers use sampling — selecting a subset of respondents that represents the whole. A well-designed sample saves time, cuts costs, and still provides reliable insights. A poorly designed sample, on the other hand, can mislead decisions and waste lakhs in marketing budgets.
7.1 Probability Sampling Methods
Probability sampling means every unit in the population has a known, non-zero chance of being selected. This allows generalization and calculation of margins of error.
- Simple Random Sampling (SRS): Every person has an equal chance. Example: randomly selecting 1,000 registered Paytm users.
- Stratified Sampling: Divide the population into strata (e.g., income groups, regions) and sample proportionately. Example: splitting Indian households into SEC A/B/C categories.
- Cluster Sampling: Select groups instead of individuals. Example: choosing 10 Tier-2 cities and then surveying 200 households per city.
- Systematic Sampling: Pick every nth element. Example: calling every 5th number in a telecom database.
7.2 Non-Probability Sampling Methods
In non-probability sampling, not everyone has an equal chance of being selected. It’s faster and cheaper but less generalizable.
- Convenience Sampling: Whoever is easiest to reach. Example: asking students outside an MBA college.
- Quota Sampling: Fill quotas for categories (e.g., 40% male, 60% female) without randomization.
- Purposive Sampling: Targeted selection based on judgment. Example: interviewing only CFOs for a finance study.
- Snowball Sampling: Existing respondents recruit others. Example: finding B2B SaaS users via referrals.
7.3 Determining Sample Size
The right sample size depends on three factors:
- Population size: Larger populations need larger samples for precision.
- Margin of error: Smaller error requires bigger sample. (±5% margin → ~400 respondents for large populations).
- Confidence level: Most studies use 95% confidence; higher confidence = larger sample.
Indian example: A mobile brand launching a ₹10,000 smartphone tests with 500 respondents in Delhi, giving ±4.5% margin of error at 95% confidence.
7.4 Sampling Challenges in India
India’s diversity makes sampling complex:
- Urban vs Rural: Behavior and access differ; rural areas often underrepresented.
- Language barriers: 22+ official languages — questionnaires need careful translation.
- Digital divide: Online panels skew urban, younger, higher-income.
- Cultural variation: Festive shopping habits differ across regions (Diwali vs Onam vs Pongal).
- Hard-to-reach groups: Business leaders, doctors, HNIs require purposive or snowball sampling.
Pro Tip: In India, don’t rely only on online convenience samples — they miss rural and low-income consumers. Always mix probability methods (for generalizability) with purposive samples (for niche insights).
8) Data Collection Methods in Business Research
Once you define your research design and sampling plan, the next question is: where will the data come from? Business research uses two main streams — primary data (directly collected for the study) and secondary data (already available from existing sources). Each has its strengths, and the best studies often combine both.
8.1 Primary Data Collection
Primary data is collected first-hand for the specific research objective. It’s original, current, and tailored — but often more expensive and time-consuming.
- Surveys: Online, phone, or face-to-face questionnaires (e.g., customer satisfaction surveys).
- Interviews: One-on-one deep dives with decision-makers or consumers.
- Focus groups: Small group discussions to explore perceptions, emotions, and preferences.
- Observation: Tracking behavior in natural settings (store visits, app session logs).
- Experiments: Controlled tests (A/B tests, product trials).
Indian example: An FMCG brand testing a new shampoo variant runs home-use trials with 200 women in Delhi and Bangalore.
8.2 Secondary Data Collection
Secondary data comes from existing sources. It’s faster and cheaper but may not be fully aligned with your research needs.
- Internal company data: CRM databases, sales reports, customer support tickets, ad performance data. For example, see our Facebook Ads in India Guide where ad-level data itself becomes a research source for campaign optimization.
- Government data: Census, NSSO, RBI, TRAI, SEBI reports.
- Industry reports: Market research firms like Nielsen, Kantar, EY, McKinsey.
- Academic journals: Peer-reviewed studies in management, economics, and psychology.
- Digital platforms: Google Analytics, YouTube Insights, social media dashboards.
Indian example: A fintech startup analyzing RBI’s monthly transaction reports to assess UPI adoption growth in Tier-3 towns.
8.3 Online & Digital Data Sources
With digitization, new streams of data have opened up. Today’s businesses collect real-time behavioral data from multiple touchpoints:
- Web analytics: Tracking visits, bounce rates, conversions.
- Social listening: Monitoring brand mentions, sentiment analysis, trending hashtags.
- E-commerce platforms: Cart abandonment, order frequency, return rates.
- Mobile apps: Session time, feature usage, churn data.
Indian example: Myntra tracking which filters shoppers use most during the “End of Reason Sale” to optimize app navigation.
8.4 Emerging Data Collection Methods
As technology evolves, researchers are adopting advanced methods that go beyond traditional surveys:
- Sensor data: IoT devices tracking consumer behavior (e.g., smart refrigerators tracking FMCG use).
- Eye-tracking: Measuring visual attention in ads, packaging, or website layouts.
- Heatmaps: Recording how users interact with web pages or mobile apps.
- AI-enabled chatbots: Conversational surveys collecting feedback in real-time.
Indian example: An edtech app using AI chatbots to gather instant feedback from students after each lesson.
Pro Tip: In India, don’t underestimate secondary data — government sources like the Census or RBI reports often give more representative insights than expensive primary surveys.
9) Instrument Design & Questionnaire Construction
Even the best research design can fail if the questionnaire or instrument is poorly built. The wording of a single question can bias results, confuse respondents, or reduce response rates. Designing effective instruments means balancing scientific rigor with human psychology.
9.1 Principles of Questionnaire Design
- Clarity: Use simple, everyday words. Avoid jargon unless targeting experts.
- Neutrality: No leading or loaded questions (“Don’t you agree…” is bad design).
- Single-focus: Ask about one concept per question — avoid double-barrelled items.
- Balanced options: Provide ranges, not extremes (“Poor → Average → Good → Excellent”).
- Logical flow: Start broad, then move into specifics; sensitive questions at the end.
Indian example: An e-commerce study asks, “How satisfied are you with delivery speed?” (simple, single-focus) instead of “How satisfied are you with delivery speed and packaging?” (double-barrelled).
9.2 Pre-testing & Pilot Studies
Before rolling out to thousands of respondents, questionnaires should be pre-tested with 20–50 participants. This helps identify confusing questions, missing options, or technical issues in online forms. Pilot studies save time, money, and reputation.
Indian example: A bank pre-tests its customer satisfaction survey with 30 account holders to check if financial terms are understood in Hindi and English.
9.3 Cognitive Interviews & Multilingual Design
In multilingual countries like India, direct translation doesn’t always work. Cognitive interviews — where respondents explain how they understood a question — help catch misinterpretations. Back-translation (English → Hindi → English) ensures accuracy.
Indian example: A retail survey finds that “household income” is misunderstood in some regions as “monthly pocket money,” requiring wording changes.
9.4 Avoiding Bias in Questionnaires
- Leading questions: “How amazing was your experience?” (biased) vs “How would you rate your experience?” (neutral).
- Order effects: Randomize answer options to avoid primacy bias.
- Social desirability bias: Use indirect questioning for sensitive topics.
- Acquiescence bias: Include both positively and negatively worded items.
Connection: Just like people carefully curate self-descriptions online (see our VIP Instagram Bios Guide), survey respondents are influenced by wording and framing. Smart questionnaires account for this human tendency.
Pro Tip: Always run a pilot in at least two languages before launching nationwide in India. Misinterpreted questions can distort results more than small sampling errors.
10) Data Analysis in Business Research
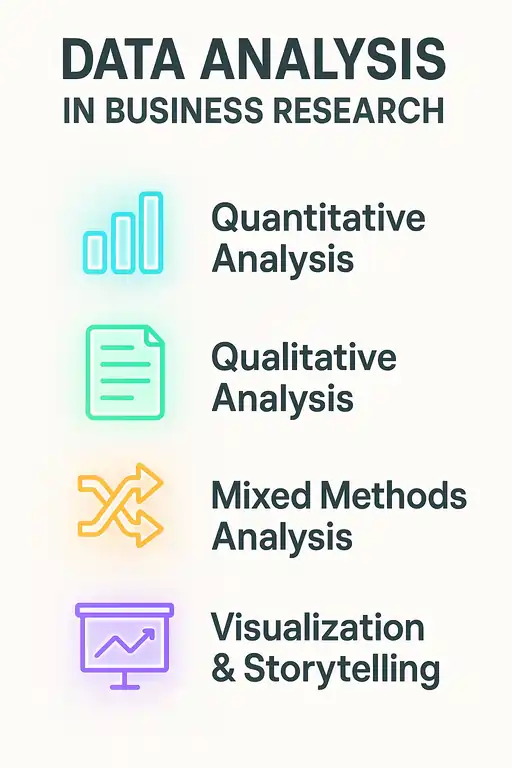
Collecting data is only half the battle. The true value of business research comes from data analysis — the process of turning raw numbers and words into insights managers can act on. Analysis can be quantitative, qualitative, or mixed, depending on the research design and objectives.
10.1 Quantitative Analysis
Quantitative analysis uses numerical data to identify patterns, test hypotheses, and make predictions. It’s the backbone of market sizing, campaign measurement, and financial forecasting.
- Descriptive stats: Mean, median, mode, frequency distributions.
- Inferential stats: Correlations, regressions, hypothesis testing (t-test, ANOVA, chi-square).
- Multivariate techniques: Factor analysis, cluster analysis, conjoint analysis, structural equation modeling.
- Predictive analytics: Time-series forecasting, machine learning models.
Indian example: A retail chain running regression to see how discounts, store visits, and ad spend impact monthly revenue. Similarly, ad agencies (see our YouTube Ads Agency in India Guide) analyze campaign performance data with quantitative techniques to calculate ROI.
10.2 Qualitative Analysis
Qualitative analysis explores meanings, perceptions, and motivations hidden in text, speech, or behavior. It helps businesses understand the “why” behind consumer choices.
- Coding: Tagging text into categories (open → axial → selective coding).
- Thematic analysis: Identifying recurring themes in interviews or focus groups.
- Discourse analysis: Studying how language shapes meaning (ads, brand narratives).
- Content analysis: Quantifying keywords, mentions, or sentiment in text data.
Indian example: An edtech startup analyzing parent interviews to find recurring concerns about “screen time” and “concept clarity.”
10.3 Mixed Methods Analysis
Many businesses now use mixed methods — blending numbers with narratives. Quantitative data gives scale, while qualitative adds depth.
- Survey + interviews to validate findings.
- Experiments + follow-up focus groups to refine why results occurred.
- CRM analytics + ethnographic observation to reveal both what and why.
Indian example: A D2C health brand first surveys 1,000 users on purchase drivers, then conducts 20 interviews to explore emotional triggers behind “healthy lifestyle” purchases.
10.4 Visualization & Storytelling
Data analysis is wasted if stakeholders don’t understand it. Visualization turns complex findings into actionable stories.
- Dashboards: Real-time tracking via Tableau, Power BI, Google Data Studio.
- Charts & heatmaps: Simplify results for decision-makers.
- Infographics: Combine visuals with insights for client presentations.
- Storytelling: Linking data to business goals and narratives (“this 10% discount lifted sales by ₹50 Cr during Diwali”).
Indian example: A fintech startup presenting investor reports with growth charts and annotated customer feedback quotes to humanize the numbers.
Pro Tip: Always match the depth of analysis to the business problem. Don’t run structural equation models when a simple bar chart answers the CEO’s question faster.
11) Causal Inference for Business Decisions
In business research, one of the hardest questions is: did X cause Y? For example, did sales rise because of the new ad campaign — or because of Diwali season? Causal inference provides the tools to separate coincidence from causation. Without it, businesses risk making expensive decisions on false assumptions.
11.1 A/B Testing in Digital Marketing & Products
A/B testing is the gold standard for causal inference in digital marketing and product design. By splitting users into control and treatment groups, businesses can isolate the effect of a single change (ad creative, landing page, discount offer).
Indian example: Swiggy tests two push notifications: one offering “₹50 off” vs another offering “Free Delivery.” The split shows free delivery increased conversions by 18%.
For a step-by-step guide to running such experiments in ads, see our YouTube Ads in India Guide, where structured causal testing helps businesses optimize ROI.
11.2 Quasi-Experimental Methods
When true experiments aren’t possible, researchers use quasi-experimental methods. These rely on naturally occurring differences, not random assignment:
- Difference-in-Differences (DiD): Compares changes over time between a treatment group and control group. Example: measuring sales in states where a new GST rule applied vs states where it didn’t.
- Synthetic Control: Builds a “synthetic twin” of the treatment group using weighted averages of other units. Example: creating a synthetic benchmark for states without UPI adoption to measure UPI’s true impact.
- SDID (Synthetic Difference-in-Differences): Combines both for stronger causal identification.
Indian example: A telecom company evaluating whether a new unlimited data plan actually boosted ARPU compared to regions with older plans.
11.3 Challenges of Causality in Business
Establishing causality is complex because business environments are noisy:
- Confounders: Other variables (seasonality, competitor actions) may explain results.
- Selection bias: Treatment groups may differ systematically from control groups.
- Measurement error: Poorly defined metrics can create false causal links.
- External validity: A successful experiment in Delhi may not work in Tier-3 towns.
11.4 India-First Case Studies
- Policy evaluation: NITI Aayog uses DiD to evaluate how UPI adoption changed payment volumes compared to non-UPI states.
- E-commerce: Flipkart tests whether adding “Cash on Delivery” boosted conversion in Tier-2 cities more than in metros.
- Digital ads: A D2C beauty brand runs multivariate tests on YouTube ads, finding that adding testimonials boosted CTR by 22%.
Pro Tip: If you can’t run a true A/B test, don’t give up. Use quasi-experiments like DiD or Synthetic Control — they’re often good enough to convince boards, investors, and regulators when designed rigorously.
12) Business Research Ethics & Governance
Good research is not just about accuracy — it’s also about ethics. Unethical data collection can destroy trust, invite lawsuits, and damage a brand’s reputation. In today’s world of AI-driven data collection and digital privacy laws, ethical governance in business research is more important than ever.
12.1 Codes of Conduct
Professional organizations set global standards to ensure business research respects participants and delivers credible insights:
- ESOMAR: International code for ethical market and opinion research.
- AAPOR: U.S.-based code emphasizing transparency in methodology and reporting.
- MRSI (Market Research Society of India): India’s industry body with guidelines tailored to local challenges.
These codes stress voluntary participation, informed consent, confidentiality, and fair reporting.
12.2 Informed Consent & Confidentiality
Participants must know why data is being collected and how it will be used. This includes:
- Clear consent forms: Simple language, no hidden terms.
- Confidentiality: Responses anonymized unless explicit permission is given.
- Right to withdraw: Respondents can opt out at any stage without penalty.
Indian example: A healthcare startup running patient surveys must ensure all health-related responses are anonymized and stored securely, with withdrawal rights clearly explained.
12.3 Data Protection Laws (GDPR vs DPDP Act)
With data collection becoming digital, legal compliance is non-negotiable:
- GDPR (Europe): Requires lawful basis for data collection, strict consent, right to be forgotten.
- India’s DPDP Act (2023): Introduces data fiduciary responsibilities, explicit consent requirements, and penalties for misuse of personal data.
Business implication: A company conducting customer research in India must now keep auditable records of consent and ensure data storage complies with the DPDP Act.
12.4 Ethical Dilemmas in Business Research
Even with codes and laws, businesses face gray areas:
- Using incentives: How much is too much before it becomes coercion?
- Children as respondents: Needs parental consent and special safeguards.
- Passive data collection: Tracking behavior via cookies or apps without clear disclosure.
- AI & deepfakes: Risks of synthetic interviews or manipulated responses if misused.
Connection: Just like advertising must follow platform rules (see our Facebook Ads Agency in India Guide), research must follow ethical guidelines. Shortcuts may look profitable, but they backfire long-term.
Pro Tip: In India, always document consent digitally (checkboxes, OTP verification) for compliance with the DPDP Act. It’s faster, auditable, and builds participant trust.
13) AI & Technology in Business Research
The future of business research is inseparable from artificial intelligence (AI) and digital technology. Traditional surveys and manual coding are giving way to AI-driven tools, predictive analytics, and real-time insights. This shift is helping Indian companies cut costs, accelerate decision-making, and stay ahead in competitive markets.
13.1 AI in Data Collection
AI is transforming how businesses gather primary data:
- AI chatbots: Replacing survey forms with conversational interfaces that adapt in real time.
- Voice recognition: Collecting feedback via natural speech, supporting India’s multilingual diversity.
- Smart sampling: Algorithms optimizing respondent selection to balance urban/rural, age, and income groups.
Indian example: An edtech startup uses AI chatbots in Hindi and English to collect lesson feedback from 50,000 students across 12 states in one week.
13.2 AI in Data Analysis
What used to take weeks of manual coding can now be done in hours with AI:
- Natural Language Processing (NLP): Coding open-ended responses into sentiment categories.
- Machine learning models: Predicting churn, purchase intent, and cross-sell potential.
- Generative AI (LLMs): Summarizing thousands of interview transcripts into actionable insights.
Indian example: A retail bank uses NLP to analyze 100,000+ customer complaint emails, finding that “slow response time” is the #1 theme across regions.
13.3 Predictive & Prescriptive Analytics
AI doesn’t just analyze the past — it forecasts the future and suggests actions:
- Predictive analytics: Forecasting sales, demand, and market shifts.
- Prescriptive analytics: Recommending pricing strategies, product bundles, or media mix allocations.
- Real-time optimization: AI adjusts campaigns live based on performance signals.
Indian example: An e-commerce platform predicts festive demand for smartphones and pre-orders inventory two months early to avoid stockouts.
13.4 Automation & Dashboards
Modern business research integrates directly with decision systems:
- Real-time dashboards: Auto-updated KPIs for CXOs.
- Workflow automation: Alerts when satisfaction drops or churn risk spikes.
- Self-service tools: Non-analysts using drag-and-drop dashboards powered by AI.
Indian example: A D2C fashion brand sets up automated dashboards showing ad ROI, NPS, and repeat purchase rates updated daily.
Connection: To explore specific tools powering this AI shift, check our Best AI Tools for Business Owners in 2025 guide — where we review India-relevant AI platforms for content, analytics, and automation.
Pro Tip: Don’t just adopt AI tools blindly. Align them with research objectives — use predictive models for forecasting, NLP for customer voice, and chatbots for scalable feedback.
14) Emerging Trends & Future of Business Research
Business research is evolving faster than ever. New technologies, regulatory shifts, and consumer expectations are reshaping how companies collect, analyze, and apply insights. The future will be defined by automation, personalization, ethics, and sustainability.
14.1 Metaverse & AR/VR Research
Virtual worlds are opening new possibilities for consumer research:
- Virtual store testing: Tracking shopper behavior in simulated environments before real-world launches.
- Immersive focus groups: Conducting discussions in VR to study body language and interaction.
- Ad effectiveness studies: Measuring engagement with 3D immersive ads.
Indian example: A real estate company using VR tours to test which apartment layouts buyers prefer most before launching new projects.
14.2 Neuromarketing & Biometrics
Neuromarketing applies neuroscience to understand subconscious reactions to ads, packaging, and products:
- EEG & fMRI scans: Measuring brain activity while viewing campaigns.
- Eye-tracking: Studying attention to logos, colors, and call-to-actions.
- Biometric sensors: Tracking pulse, sweat, and emotions during product trials.
Indian example: A D2C beauty brand testing ad creatives with biometric sensors to measure real emotional impact beyond survey responses.
14.3 Answer Engine Optimization (AEO)
With AI overviews and answer engines (Google AI, ChatGPT, Alexa, Gemini) shaping consumer choices, businesses must adapt their research and marketing. Instead of only asking “how do customers search,” researchers now ask “how do AI systems retrieve and present information?”
Answer Engine Optimization (AEO) is the new frontier, blending business research with digital visibility. See our AEO Scientist Lab program, which trains businesses to dominate these AI-driven engines before competitors adapt.
14.4 Sustainability-Driven Research
With climate change and ESG goals rising, business research is expanding beyond profits into social and environmental responsibility:
- Measuring carbon footprint of supply chains.
- Studying consumer willingness to pay for eco-friendly products.
- Benchmarking ESG reporting practices across industries.
Indian example: A food delivery startup researching packaging alternatives that reduce plastic without raising delivery costs.
14.5 The Road Ahead
The next decade of business research will be about speed, accuracy, and foresight. AI will handle large-scale analysis, but human researchers will still lead in framing the right questions and ensuring ethics. Businesses that combine tech-driven insights with human judgment will win in 2025 and beyond.
Pro Tip: Stay future-ready by blending classical methods (surveys, experiments) with modern ones (AI, AEO, neuromarketing). Early adopters gain an unfair advantage.
15) Applications of Business Research
Business research is not just theory — it drives decisions across every function of an organization. From marketing campaigns to HR policies, finance strategies to public policy, research provides the evidence leaders need to minimize risk and maximize growth.
15.1 Marketing & Consumer Insights
Marketing is the most visible area where business research is applied. Brands use research to test demand, understand customer behavior, and measure campaign effectiveness.
- Ad testing: Pre-launch experiments to identify winning creatives.
- Segmentation research: Dividing consumers by demographics, psychographics, or behavior.
- Customer journey mapping: Tracking touchpoints from awareness to purchase.
- Brand tracking: Measuring awareness, perception, and loyalty over time.
Indian example: A D2C beauty brand running A/B tests on YouTube ads to optimize creative and reduce cost per acquisition. For a real-world case, see our YouTube Ads Case Study where 33,500+ conversions were achieved at ₹57 CPA.
15.2 Financial & Investment Decisions
In finance, research ensures smarter allocation of capital and reduced exposure to risk.
- Feasibility studies: Evaluating profitability before major investments.
- Risk analysis: Assessing credit, operational, and market risks.
- Forecasting: Predicting revenue, demand, and cash flow.
- Valuation research: Determining fair value of businesses in M&A.
Indian example: A fintech company studying repayment behavior to refine its loan underwriting model for Tier-2 borrowers.
15.3 Human Resources & Organizational Research
HR teams use research to build better workplaces and improve employee satisfaction:
- Employee engagement surveys: Measuring morale and productivity.
- Compensation benchmarking: Ensuring pay is competitive in the market.
- Training effectiveness: Assessing ROI of learning programs.
- Diversity & inclusion studies: Understanding barriers and opportunities for underrepresented groups.
Indian example: An IT services company using employee pulse surveys to reduce attrition in Bengaluru’s competitive tech talent market.
15.4 Operations & Supply Chain Research
Efficient operations are impossible without solid research. Studies in this area aim to reduce costs and improve service quality:
- Process optimization: Time-and-motion studies to improve efficiency.
- Quality control: Statistical process control and Six Sigma methods.
- Supply chain research: Studying supplier reliability, logistics, and inventory models.
- Customer service research: Measuring turnaround time and satisfaction.
Indian example: Flipkart researching warehouse layouts to cut delivery times by 15% during festive seasons.
15.5 Public Policy & Social Impact
Business research also extends beyond companies, influencing public policy and social initiatives:
- Economic policy evaluation: Assessing GST impact on small businesses.
- Healthcare studies: Researching vaccination program effectiveness.
- Education impact: Measuring how digital classrooms improve learning outcomes.
- Sustainability studies: Tracking adoption of renewable energy and eco-friendly practices.
Indian example: NITI Aayog studying the effectiveness of UPI adoption on financial inclusion in rural districts.
Pro Tip: If you’re unsure where to apply research in your business, start with marketing and operations. These areas usually deliver the fastest ROI on insights in India’s competitive markets.
16) Tools & Platforms for Business Research
Great research needs more than ideas — it requires the right tools and platforms to collect, process, and interpret data. In 2025, businesses in India are spoiled for choice, from global software giants to local research agencies. The best approach is to combine survey platforms, analytics software, visualization tools, and specialized data sources.
16.1 Survey & Feedback Tools
Surveys remain the backbone of primary research. Popular platforms include:
- Google Forms: Free, simple, and widely used for small projects.
- SurveyMonkey: Advanced features like logic branching and benchmarking.
- Zoho Survey: Strong integration with Zoho’s business suite, popular in India.
- Typeform: Engaging conversational forms with higher completion rates.
Indian example: A coaching institute uses Zoho Survey to collect student satisfaction feedback after each batch.
16.2 Statistical & Analytics Platforms
For quantitative analysis, businesses rely on statistical software and BI platforms:
- SPSS: Widely used for academic and corporate quantitative research.
- R & Python: Open-source, powerful for custom modeling and machine learning.
- Stata: Known for econometrics and policy studies.
- Zoho Analytics: India-first business intelligence platform with drag-and-drop dashboards.
Indian example: A fintech startup uses Python for predictive modeling of loan defaults, while combining Zoho Analytics dashboards for investor presentations.
16.3 Visualization & Dashboard Tools
Visual storytelling helps stakeholders absorb complex data quickly:
- Tableau: Industry leader in BI visualization.
- Power BI: Microsoft’s accessible, cost-effective dashboarding tool.
- Google Data Studio (Looker Studio): Easy-to-integrate free visualization tool.
- Qlik: Advanced associative data exploration.
Indian example: An FMCG company uses Power BI dashboards to track sales performance across 500+ distributors in real time.
16.4 Secondary Data Platforms
Access to existing data is critical for fast, cost-effective insights:
- Google Trends: Measures shifts in consumer interest and search behavior.
- Statista: Global datasets across industries.
- CMIE (India): Comprehensive Indian economic and business datasets.
- Government portals: Census, RBI, TRAI, SEBI reports.
Indian example: A digital marketing agency studies Google Trends data on “AI tools” to predict which training courses to launch next.
16.5 Research Agencies & Outsourcing
Sometimes, businesses outsource research to professional agencies:
- NielsenIQ: Global leader in FMCG and retail research.
- Kantar: Covers media, brand, and consumer studies.
- IPSOS India: Focused on social and opinion research.
- MRSI-certified agencies: Local firms offering affordable, India-specific insights.
Connection: At The DM School, we also emphasize research-backed campaigns in digital marketing, where client ROI depends on data-driven decisions.
Pro Tip: Choose tools based on your stage — startups can begin with free tools like Google Forms and Looker Studio, while enterprises should invest in integrated BI suites like Tableau or Zoho Analytics.
17) Case Studies in Business Research
The power of business research becomes clear when we study real-world applications. From startups to conglomerates, research has helped Indian businesses identify opportunities, solve challenges, and scale sustainably. Below are case studies across industries that show how insights fuel results.
17.1 D2C Brand Optimizing YouTube Ads
A fast-growing D2C beauty brand wanted to reduce cost per acquisition (CPA) on YouTube. Through structured A/B testing, they compared testimonial-style videos against influencer-driven content. The research revealed testimonials drove 22% higher CTR and reduced CPA from ₹90 to ₹63.
Insight: Consumer trust cues (real customer stories) outperformed influencer glam, showing the importance of context-specific ad research.
17.2 Fintech Startup & Loan Default Prediction
An Indian fintech faced rising defaults among Tier-2 borrowers. Using predictive analytics on repayment history, income patterns, and mobile usage, the company created a scoring model. Default rates dropped by 18% after introducing the new model.
Insight: Secondary data (mobile usage) was as predictive as traditional financial data, highlighting the power of innovative business research in fintech.
17.3 FMCG Giant Testing Packaging in Tier-3 Markets
A leading FMCG company tested whether smaller ₹5 sachets would increase adoption in Tier-3 towns. Through in-store experiments and focus groups, they found sachets boosted trial rates by 35% and converted 22% of new buyers into repeat customers within three months.
Insight: Contextual research validated that affordability packaging drives penetration in semi-urban and rural India.
17.4 UPI Adoption & Financial Inclusion
NITI Aayog partnered with academic researchers to evaluate UPI’s role in financial inclusion. Using difference-in-differences (DiD), they compared rural districts before and after UPI adoption. Results showed a 28% increase in digital transactions within 18 months of rollout.
Insight: Policy-backed business research proved that digital payments can transform access to finance at the grassroots level.
Pro Tip: Whether you’re a startup or policymaker, always document case studies. They become proof of success, attract investors, and help teams replicate winning strategies.
18) Conclusion & Key Takeaways
Business research methods are no longer an academic exercise — they are the lifeblood of decision-making in 2025. From startups running A/B tests on digital ads to policymakers evaluating UPI adoption, structured research separates guesswork from strategy. In India’s fast-changing markets, where risks and opportunities evolve overnight, research-backed insights give businesses the edge they need to survive and scale.
The future of business research will combine AI-powered tools, human judgment, and ethical governance. Organizations that blend classical approaches (sampling, surveys, experiments) with emerging methods (AI, AEO, neuromarketing) will be the ones leading in the next decade.
📌 Key Takeaways Snapshot
- Business research is foundational: Reduces risk, identifies opportunities, and drives growth across marketing, finance, HR, and policy.
- Methods are diverse: From qualitative interviews to quantitative modeling and causal inference experiments.
- India-first challenges: Language diversity, rural vs urban divide, and affordability packaging make local context vital.
- Technology is reshaping research: AI, predictive analytics, dashboards, and Answer Engine Optimization (AEO) are the future.
- Ethics can’t be ignored: DPDP Act compliance and global codes of conduct are now mandatory for credibility.
- Case studies prove impact: D2C brands, fintech startups, FMCG giants, and government bodies all scale with research-backed insights.
Final Word: Business research is not optional in India’s digital-first economy. It’s the difference between brands that vanish in uncertainty and those that grow with confidence. The winners of tomorrow will be those who invest in research today.
19) FAQ on Business Research Methods
1. What are business research methods?
Business research methods are structured approaches like surveys, experiments, case studies, and data analysis used to solve business problems, reduce risks, and guide decision-making.
2. Why are business research methods important in India?
They help Indian companies understand diverse markets, predict consumer behavior, and evaluate strategies. With India’s urban–rural divide, research ensures campaigns and policies fit local contexts.
3. What are the main types of business research?
The main types include qualitative research (interviews, focus groups), quantitative research (surveys, experiments), and mixed-methods research that blends numbers with insights.
4. Which tools are used in business research?
Popular tools include SPSS, R, Tableau, Power BI, Google Trends, and Zoho Analytics. Many Indian firms also use local platforms and government datasets like CMIE, Census, and RBI reports.
5. How do businesses ensure ethical research?
By following codes of conduct (ESOMAR, MRSI), taking informed consent, anonymizing data, and complying with laws like India’s DPDP Act (2023) for digital privacy.
6. What is the role of AI in business research?
AI automates surveys, codes qualitative data, predicts future outcomes, and delivers real-time dashboards. It helps Indian businesses make faster, more accurate, and cost-effective decisions.
7. What is the difference between business research and market research?
Market research focuses on customers and competitors, while business research covers wider areas like finance, HR, supply chain, and policy analysis beyond just markets.